Port Scanner Shootout Part 3: The Setup
The Environment
Now that we have the parameters of our tests and chosen our contenders, we must set up our test environment and find the optimal settings for our tools.
All of the tests will be performed from our testing box, a System 76 Oryx Pro 7. This is my personal laptop of choice as it has an Intel® Core™ i7-10870H, 32gb of RAM, and the incredible PopOS as the operating system. With 1 TB of SSD storage, and virtualization support, it is a great platform with which to host our virtual machines and perform our tests.
The Attacker Box
To make our tests easily repeatable, we probably should be executing our tests from a common platform, rather than my laptop itself. In order do to that, we will be running a Kali Linux virtual machine with VirtualBox. Kali has a variety of images that can be downloaded, but the one we will use is the pre-made VM specifically for use with VirtualBox.
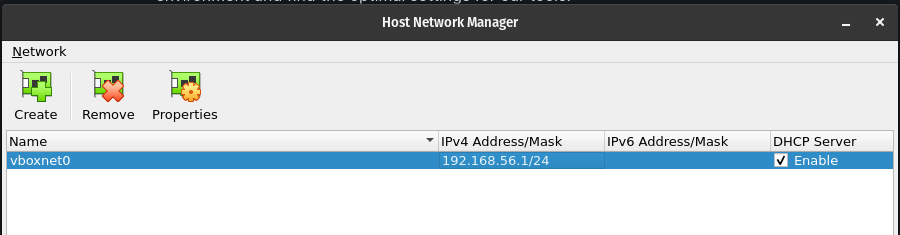
The Kali VM has most of the setup requirements ready to go out of the box, but there are a few configurations we will need to make for our tests. The first is the network settings on both Virtualbox and the Kali VM, to allow our tests to run un-impeded. In order to test the functionality of our tools with minimal performance impact of the network, we will be using an internally created, host-only network. Using the Host Network Manager of VirtualBox, we will create an internal network named "vboxnet0" with an IP address range of 192.168.56.0/24. This is the default when creating new host networks. This is also the settings that some of our other VMs will need for internal testing. Make sure you have the DHCP Server enabled so your VMs can be allocated an I address when they boot.
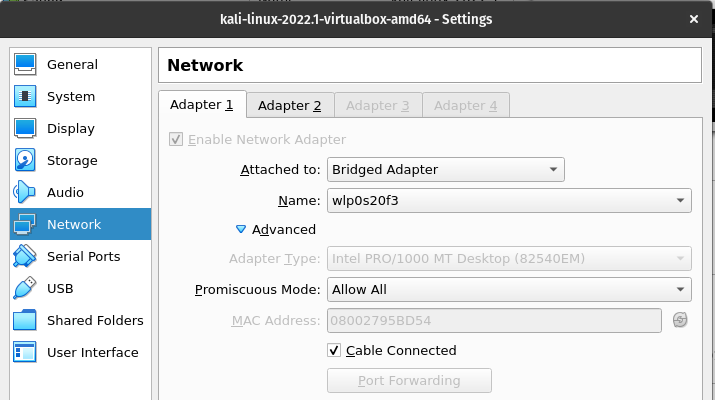
Next we will need to configure the adapter settings of Kali. We will need to do this is two separate places. First, the Kali Linux VM comes with a configured network connection for use with the VirtualBox "NAT" network setting. During setup testing, we found that this needs to be changed to "Bridged Mode" for accurate settings. For some reason, attempting in NAT lead to port scans showing all ports open by our testing tools. Under the network settings for the VM itself within VirtualBox, we will need to change the "Attached to:" setting from "NAT" to "Bridged Adapter". Make sure the "Name" field matches the name of the physical network interface on your host machine. The last setting here will be to enable "Promiscuous Mode", to allow the transfer of traffic regardless if the other communicating device is a VM or a physical device.
Now that we have our settings that allow us communication with the outside world, lets set up our internal host only connection. Next we will move one tab over from the current screen and enable the second network adapter. For this one, we will attach it to the "Host-Only Adapter" and select our host only network: vboxnet0.
Now for one final configuration. Due to the network connection settings within the Kali VM, when using the above setting, an error occurs where Kali will only request an IP address for one of the above connections, not both. To fix this, we will need to delete the current connection, and let the system establish new ones on its own. We accoplish this task by performing the following command:
After running this command, reboot your Kali box and it will properly connect to both networks.
Metasploitable 3 - The local target
For our local target, we need one that is something that would be a commonly seen type of target, with a reasonable number of open ports for which to test out scan. The folks over at Rapid7 have created a vulnerable Windows workstation image specifically for security testing, called Metasploitable. As you might have guessed, it is intended for testing the security tool Metasploit, and comes with both a Windows image as well as an Ubuntu image. While we will only be using the Windows image, they both have a handful of running services and open ports that make it a great target for local testing.
In order to use Metasploitable, we have a few dependancies that we must install to prepare our host device. The most notable is the installation of Vagrant, a virtual machine management utility.
Once these are complete, we will set up a separate workspace for Metasploitable, and have it begin setting up the targets.
The last command in the section above will download and build the VMs themselves. This may take a bit depending on your network connection.
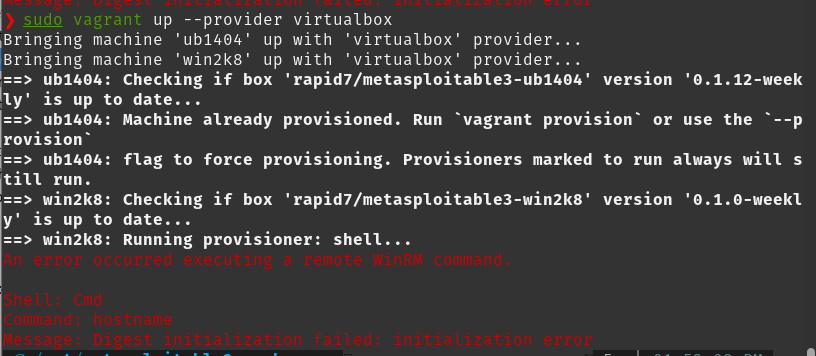
On my kali box, I encountered an error on the version of WinRM that would not let me build the images out. I solved it with the following commands and wiki post.
I also encountered this error on build:
This was fixed by upping the retry limit. Add the following to your Vagrantfile.
One final error you might encounter is the allowable networks on the Virtalbox Host-Only adapter. Virtual box by default only allows certain IP addresses on the host-only network. We can use the following commands to create a supporting conf file that fixes this problem.
Once the inital setup is complete, you can double check and launch your new target VM by running the "vagrant up" command for the image you wish to use.
Once you do this one, the Metasploitable VM will be added to your VirualBox VM list. Remember: there are separate lists depending on if you run VirtualBox as yourself or as super-user. If you dont see it at first, open VirtualBox with "sudo".
Supplementary Tooling
One of the important metrics we will be testing is the speed of the scanning tool. While some tools like NMAP have a built in runtime calculation, we will need a solid utility to be used on the tools that do not have this function. Enter Gnomon. Gnomon is a tool that annotates console logging statements with timestamps. If we run a tool in verbose mode or with any sort of debugging, we can determine the time frame of every step by simply piping our tool command into Gnomon.
Gnomon is a tool written in Node.js and managed with npm, so we will need to install the prerequisites first. Luckily, the only extras our Kali box will need is npm.
Next we will install Gnomon.
Once it is installed we simply start feeding our tool commands into it using the following methodology:
Knowing your Limits
With the tools that we have chosen, there are settings that can be applied to their commands that adjust different aspects of their tasks. The purpose of these is to fine tune the tools for optimal performance. That being said, these settings can be set past the theoretical maximums of the host VM. In order to make sure we dont set our settings beyond what we can handle, we need to run a few commands and check a few settings.
Threads
Threads are the smallest sequence of instructions a processor can handle. For our tools, the number of threads can relate to the operating speed of the tool or the number of network connections it can make. Logically, the more threads used, the better the performance. The number of threads you can use is limited by the capabilities of the processor itself. We should look to make sure we are not using more threads than our system can handle. We start by determining the maximum amount of threads our system can handle. There is a file within the kernel that we can look at that will tell us exactly that.
For the Kali VM we are using, it says that the maximum is 15167 threads. We dont want to use the maximum number as we will need some for other OS tasks, but it is safe to say that there are very few tasks that will require near fifteen thousand concurrent actions. For testing, any manipulation of thread settings would be set at 10000, to be conservative.
Open File Descriptors
Some tools require the use of an open file to facilitate the processing of a network probe, specifically so the tool can process multiples at the same time. These directly translate to the number of open sockets you can have at one time. The limit of these is determined by the flavor of host operating system, not the tool or tech specs. The limit can vary wildly between operating systems with as few as 256 for MacOS or up to 8800 for ubuntu. We can check the maximum for our Linux distribution by using the following command:
When this command is run on our Kali VM, we see a whopping 1048576 limit. This is far beyond what we need but it is good to know our limitations. Now understand that there is one caveat to these. These limits are defined within our operating system by hard limits and soft limits. The above is the hard limit, or the theoretical maximum of our device. The soft limit is a much lower, effective value for our system. This soft limit is typically set to a safe value and can often be override by user processes that may need a higher number than the standard. Hard limits can only be overwritten by a root user. We can run the following command to determine our soft limit.
For more information about how these are used, the documentation behind Rustscan has some good information on manipulating the ulimit.
Network Speed
As we all know, we do not have control over the speed of the internet, only our own connection to it. Our tests will involve scanning on both the local network and a remote host on the internet to determine the impact that it has on the performance of our scans. In order to do that, we must first determine the performance of our own network connections. As most people have internet connections that are asynchronous (upload and download speeds are different), our limitation typically be our own upload speed.
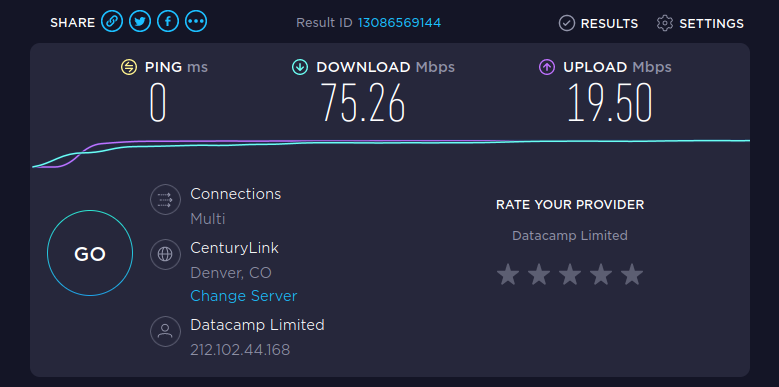
I always test my connection speed before and after tests, to make sure there is no infrastructure issues that I am not aware of.
While it is a bit bloated with ads, Ooklas speedtest.net has always been solid and accurate for home network speed tests.
Now we know our throughput, but how does that translate to the common tool setting of packets per second? Well lets follow a few steps. Most port scanning tools will use TCP SYN scanning to check for open ports. One SYN scan packet is roughly 44 bytes. Lets round up to 50 bytes for a buffer that accommodates for variance. If we assume a 10 mbps upload, our own connection could easily handle up to 200,000 packets per second.
Tool Setup and Optimization Testing
Now that we know the limits of our testing platform, we need to setup our tools and determine the limits of the tools themselves. The standard at which we are comparing all of our tools is NMAP. It is also the easiest to configure as it comes with our Kali distrobution as well as it has configuration templates for different types of scanning that makes its use quite easy. We will go into more detail on those templates later.
Masscan
Masscan setup and config is the easiest of the three as it comes already installed on Kali Linux, as well as has relatively fewer adjustable settings that impact scanning performance. For debian/Ubuntu we can install it through the following commands:
Now that we have the tool installed we need to determine what parameters are adjustable. A simple "-h" flag will show the help page for the tool and give us all of the options available. In it there is only one primary parameter that we can adjust: rate (packet rate).
The default transmission rate for Masscan is at 100 packets per second. As with our previous platform testing we know that we can easily accommodate more. We will tart by testing our tool against a single remote host and incrementally increase the max-rate until we start to see a decrease in accuracy. We will also run the tests three times at each speed to make sure we have consistent results. The results are documented as Speed/Number of ports detected. The target currently has 13 open ports.
The tests were performed with the following query and only the --rate parameter was adjusted.
From this we an see that after about 3000 packets per second, we start seeing hits to accuracy.
Important testing flags:
--rate=3000 - The maximum effective rate of packets per second
--wait 0 - Masscan also has a built in function where there is a "Spindown" time at the end of a scan. Adding the flag of "--wait 0" removes the wait at the end of the scan without any detected impact to the accuracy of the scan.
Naabu
Setting up and configuring Naabu is slightly more complicated than the previous tool, but Kali Linux does make it a bit easier. Kali already has a repository that is mapped to the Naabu code, so installing it is a simple one line command.
For those without the Kali distribution, we will need a few dependencies first. Naabu is a tool written in Go, so its use will require the installation of golang. We will also need the libpcap library installed. All of these can be accomplished with the following commands.
For optimizing Naabu, there will be three parameters that we will need to adjust: Internal threads, rate of scans, and the timeout settings when waiting for a response to our probes.
Starting with out threads, Naabu has an option to adjust the amount of internal worker threads it uses for processing its scanning tasks. It defaults to 25 internal threads, but lets see how changing them affects the performance. We are using the below query for testing where the only parameter that will be changed is the internal threads, marked with "-c"
As we can see, changing the internal worker threads on a single target scan, has little impact on speed or accuracy. This might change under a heavy load, but it appears safe to say that increasing the thread count is a pretty safe bet to accommodate any struggles you might have in your scan. For the performance testing of Naabu we will use 100 internal worker threads with the flag "-c 100". You might also note that it appears to have some accuracy impact if you lower the worker threads below the default, but I cannot think of a reason to do so other than testing.
Next lets look at the scanning speed. To add some variance to our scanning, the tests we ran included single target scans as well as scanning a subnet to determine if the number of targets impacted the scanning efficiency. Tests were run using the following two commands where only th rate was changed.
As we can see with both of these, accuracy starts to suffer past 7000 packets per second. It is interesting to see that there is little difference when scanning a single target vs multiple targets within a subnet.
The last item we will test is the timeout delay. This is the time frame with which a port will remain open, waiting to receive a probe response before it closes and continues with its scanning. Now here is the kicker. This is almost entirely dependent on your network connection to the target. A simple Ping command will tell you the round trip latency for sending a packet to your target. For most folks with solid network connections, this can be blindingly fast. The best I have ever tested was on my home fiber connection that gave me a 17ms ping to the testing server. For testing our tools we will start with 250ms which is the timing delay for one of the more common NMAP scanning templates. The trick will be to see if increasing the delay time will increase our accuracy, without sacrificing too much of our speed. To do that, we will take one of the tests above with poor accuracy but high speed, and incrementally increase the timeout to see what happens.
So these results are a bit odd. Changing the timeout delay did not appear to change the accuracy or performance beyond adding the timeout to the total scan time, until we reached 1000ms. Once there the scan started taking significantly longer, but the accuracy did improve. That being said, by using our 250ms delay and the optimized scanning rate above, we can achieve a much faster overall time than using a faster packet rate, and compensating for its inaccuracy with an extended timeout period.
Important testing Flags
-warm-up-time 0 - removes warmup time delay between scanning tasks
-c 1000 - increase number of threads to reasonable amount. (Default is 25)
-rate 7000 - Maximum of 7000 packets per second before drops in accuracy were seen.
-timeout 250 - Standard timeout of 250ms waiting for probe responses.
Rustscan
Rustscan has a couple of different ways to be installed on a device. The author preferred method is to install it with its Docker container, but you can install it directly using the package manager for Rust called Cargo. On our device we start by installing the Rust language, installing the Cargo package manager, and install Rustscan.
The last line adds your cargo binaries to be added to your PATH variable, allowing you to execute them without declaring the path to thier location.
For testing Rust scan we will have three variables to test: batch size, timeout, and ulimit. Ulimit, as stated above is the number of open files available to be used by processes. This is where we will start using the following command and only adjusting the ulimit parameter
It looks like our ulimit sweet spot is sitting at 2500. The theoretical maximum is far above that, but it is interesting that limit before accuracy is impacted is so different.
Next we will adjust our batch size. Our default is 4500 probes in a batch. Lets see how we can affect the performance by adjusting the batch size using the same command as above, and using our new ulimit parameter of 2500.
This is very interesting results. If we have our ulimit set to 2500, it appears as if any bit rate above that has no affect on total performance. What isnt listed here is that when we set our bit rate to equal to the Ulimit, we receive an open file limit error. We can see an increase in scanning speed when setting below our ulimit but not equal to or above it. It seems as if the best course of action is to set the bit rate close to the ulimit without matching it exactly. That being said, the learning engine built into the tool is supposed to adjust non-declared settings on the back in to optimize your searches, but we will drive manually for these tests.
The last adjustable data point is the timeout. Our testing showed similar results to the above adjustment of timeout, so we will use our common timeout scheme of 250ms.
Important Testing Flags
--ulimit 2500 - Maximum open files before drops in accuracy were seen
--rate 2000 - The effective packet rate just below the ulimit
--timeout 250 - Standard timeout of 250ms waiting for probe responses.
-g - This makes the output grepable and much easier to read.
To be continued...
We have set our stage, we have met our challengers, and we have done all the preparations for our final showdown. Who will reign supreme? Lets find out!
Last updated